

Are you curious about the average police response times? Knowing that emergency services can reach your location quickly helps to provide peace of mind. However, fast police response times may not always happen in your local area.
When checking the most up-to-date information on police responses, we found widely different times. From 145 to 22 minutes, there is a large discrepancy depending on what police department operates in your city.
If you’ve never contacted your local police department, you may be curious how long they would take to arrive. Keep reading further to learn more about response times for major cities.

How Response Times Are Calculated
Before learning about the response times of police departments nationwide, you should first learn the calculation process. Local police departments have different methods in how they measure response times.
Generally, a police department will record the response based on all processes in the dispatch process. From the initial call to the dispatch center to the travel time of the officer, the response time data includes all steps in the process.
However, a police department may attempt to improve its response time data by not publishing the pre-dispatch call times. For example, a dispatch center may place you in a call queue for 5 minutes before speaking to you about the emergency.
While this process adds 5 minutes to the response time, a police department may choose not to include it. Before you confirm the time in your city, you should establish how the law enforcement agency collects data.
Police Dispatch Priority Levels
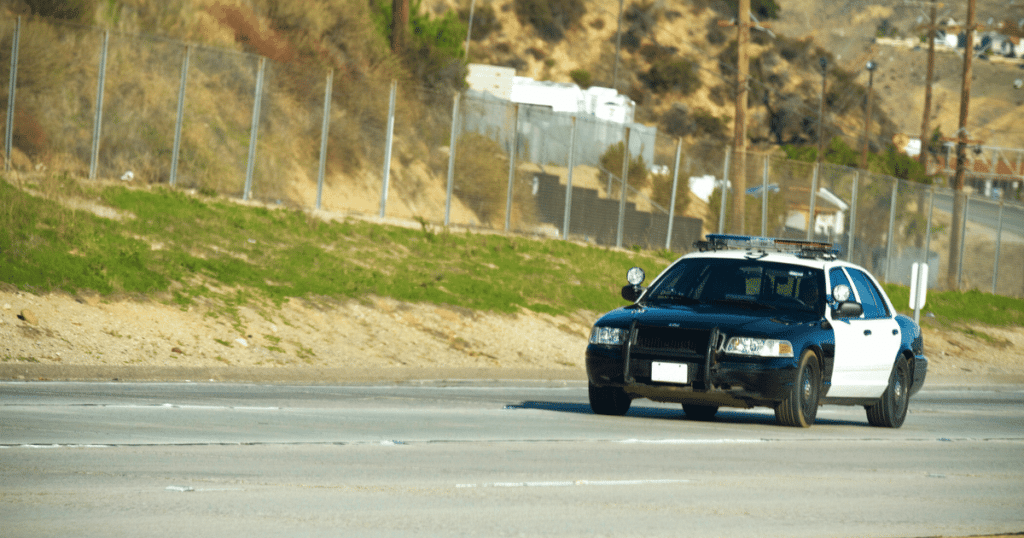
Half of police departments in the United States have a priority system that determines the urgency of a dispatch call. When a dispatcher informs a police officer of an incident, they will use a response code, such as Code 1, Code 2, or Code 3.
These priority code levels typically mean the following:
- Priority Code 1: The situation requires urgency and a fast response time. These codes generally are labeled to serious events such as homicides, officer injuries, and active threats.
- Priority Code 2: This code is for non-active threats but still requires quick assistance to the crime. These codes label events such as domestic violence, theft with violence, and ambulance escort.
- Priority Code 3: A code 3 event does not need immediate response and is listed as the lowest priority if other crimes occur in the area. These codes notify events such as suspicious people, shoplifting, and vehicle accidents.
Every police department has unique definitions of priority codes, but these are the general rules for the codes. In some cases, like the Los Angeles Police Department, they have removed priority one calls and have replaced them with code 2.
However, informing you of the priority code system is important, as the response for different crimes will change. A non-violent crime will not garner a response as fast as an active threat in the area.
The Average Police Response Times
| City | Population (Est 2022) | Police Response Time |
|---|---|---|
| New Orleans, LA | 390,845 | 145.8 minutes |
| Nashville, TN | 692,587 | 73.8 minutes |
| Portland, OR | 653,115 | 48.6 minutes |
| New York City, NY | 8,336,817 | 33.0 minutes |
| San Francisco, CA | 883,305 | 78.5 minutes |
| Detroit, MI | 670,031 | 40.4 minutes |
| Houston, TX | 2,320,268 | 64.7 minutes |
| Seattle, WA | 744,955 | 61.8 minutes |
| Virginia Beach, VA | 450,138 | 29.8 minutes |
| Cincinnati, OH | 309,317 | 22.2 minutes |
We used cities with various populations and police departments to showcase the differing response times. Among cities, the fastest response time to priority 1 calls was Cincinnati, OH, and the times have gotten faster.
However, the slowest response times recorded were from the New Orleans Police Department. The NOPD had an average response time of 50.8 minutes in 2019, which increased to an average response time of 145.8 minutes in 2022.
Why Are Police Response Times Increasing?
According to Jeff Asher, there has been a general increase in police response times around the United States. While many increases have been small, some law enforcement agencies are seeing large spikes.
While there is no one answer to why this increase is happening, the consensus is staffing declines and reduced funding. Many police departments featured in this article have had thousands of officers leave their force.
As the staffing decline worsens, some cities have resorted to hiring private security firms to protect property. Unfortunately, we don’t see this trend reversing soon, and police departments will continue to lose staff in major cities.
Frequently Asked Questions
In 2022, the average response time of police departments in the United States varied, typically from 8 to 12 minutes for priority calls. The location, urban density, and resource allocation influenced these times. However, there is no requirement for law enforcement agencies to release this data, so it has limited accuracy.
Unfortunately, there is no way to identify the fastest police response in the United States. With an estimated 18,000 law enforcement agencies, there is a large variety of police departments with varying data collection. However, we can say that smaller cities generally have faster police response times than large metropolitan areas.
The New York City Police Department (NYPD) is currently the largest police department in the United States. With over 35,000 sworn officers in 2022, it serves as a key law enforcement agency in the Big Apple, maintaining public safety and enforcing the law across the five boroughs of New York City.
Conclusion
Police response times will differ depending on the city and the priority of the crime. We recommend researching “[YOUR CITY] police response times” to learn more about your location.
If you have more questions about police response times, let us know in the comments!
Sources:
https://sf.gov/sites/default/files/2022-12/FY22-APR%20Final%20Report%20w%20Appendix-12.5.22.pdf
https://www.nyc.gov/site/911reporting/reports/response-time-trends.page?kbid=148048